A planning aid built for families, riders, and neighbors
Everything is free and runs in your browser — no account, no sign-in. Share a route by link, or download it as GPX for your device.
Explore the stress map
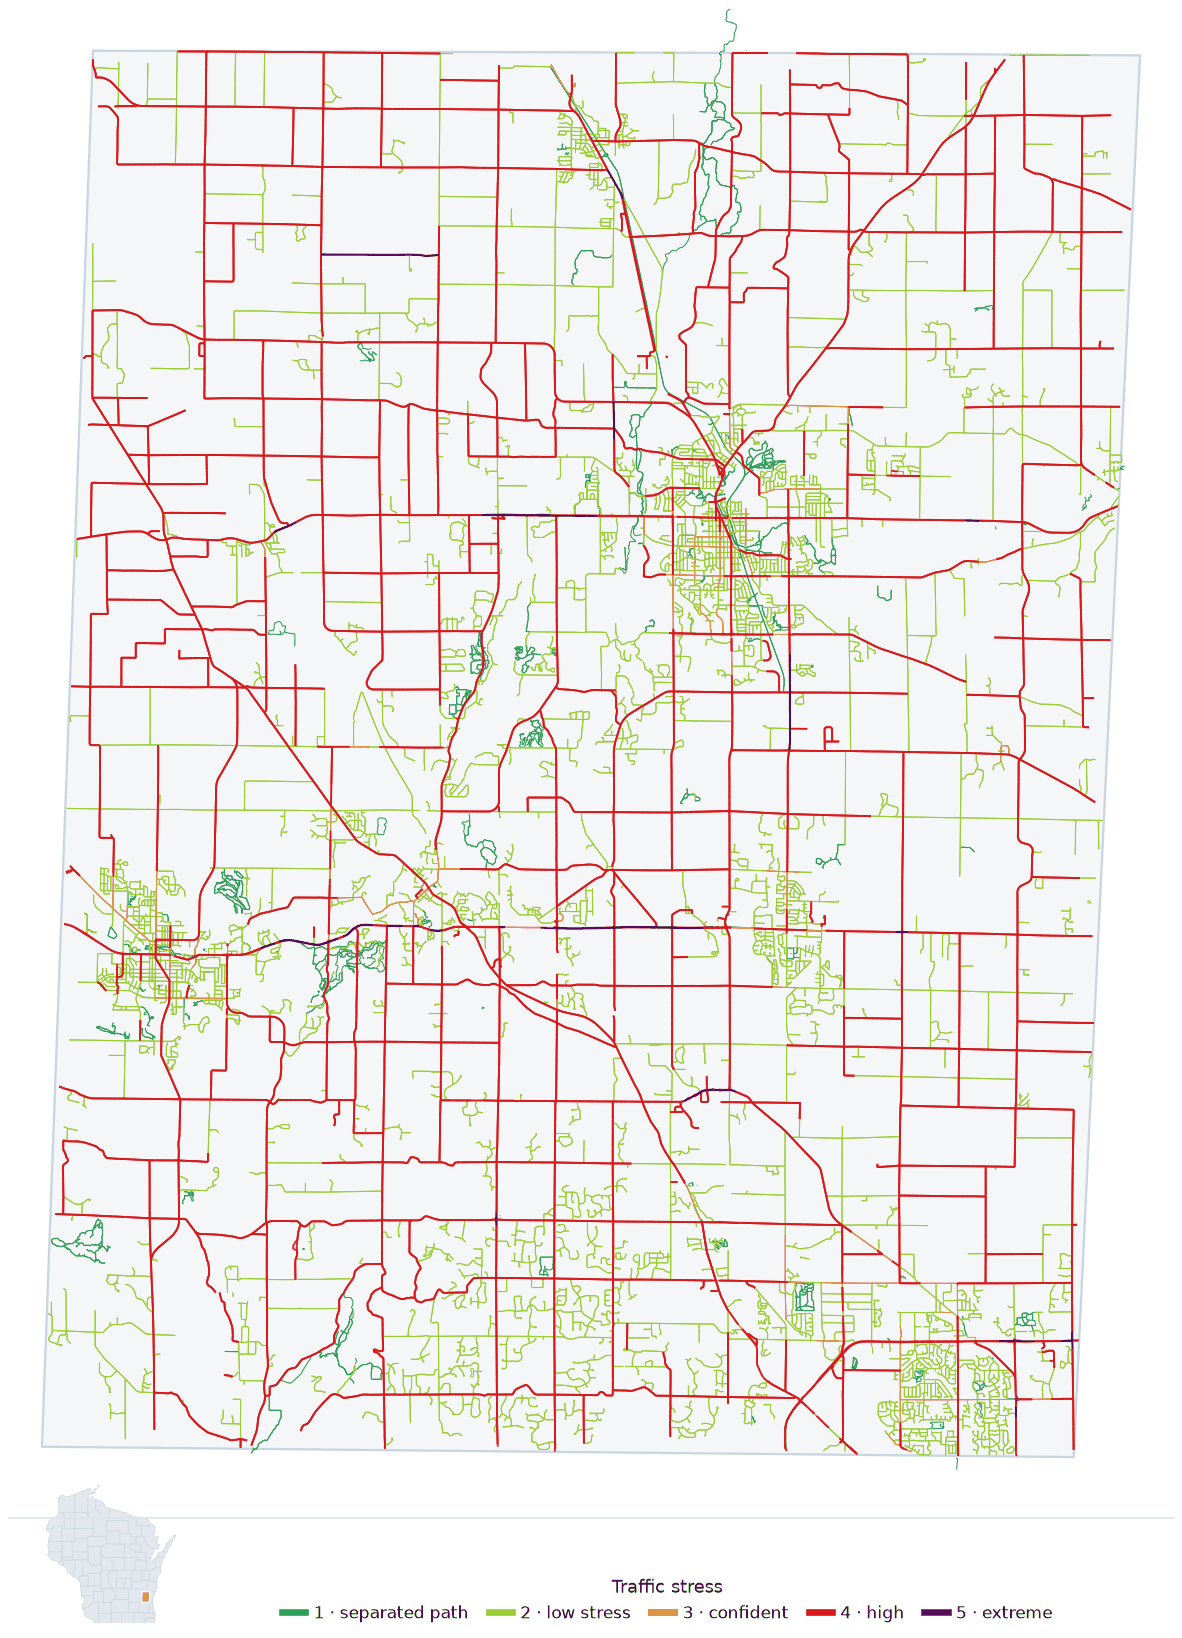
Color-coded traffic stress for the whole state, with layers for traffic volume and planned bike projects. Zoom to your county and see your streets the way a cautious rider does.
Every street in the state, colored by stress.
Plan a low-stress route
Pick two places — home to school, house to park — and compare the safest, balanced, and most direct options, with hill avoidance and clear warnings where you must cross a busy road.
Safest, balanced and most direct, with hill avoidance.
Log the trips you want
Record rides you take, or wish you could take. Trip points are stored as the nearest street corner — pulled further away in low-density areas, never your exact house. Together these become your community's case for safer crossings.
Rides you take or wish you could: the case for safer streets.
Share what you see
A new path, a changed speed limit, a road that rides differently than it scores — one tap on the map sends it for review. Every flag is checked against the scoring method, and updates that trace to OpenStreetMap land on a public task list anyone can tackle.
One tap flags a spot for review.
Find your county
Every Wisconsin county is scored with the same method. Jump straight to yours for its stress picture and a route planner that knows its streets.
Traffic stress, scored the way agencies score it
Every segment receives a bicycle Level of Traffic Stress (LTS) rating from posted and observed speeds, lane counts, and bike facilities — the same Montgomery County / Mineta-lineage method used in professional bicycle network plans, applied to OpenStreetMap data enriched with WisDOT and City of Madison traffic counts.
Full write-up: how routes and stress scores are computed (PDF).
From one ride to a safer street
There are two ways to help, and they work on two speeds. Sharpen the map: share what you see on the ground — every rider flag is reviewed against the scoring method, and improvements often ship within days. Build the case: log the trips you take or wish you could — that record is what wins crossings, paths, and calmer streets over months and years.
Ride — or wish you could
You log a trip you take, or one you'd take if it felt safe. It takes about a minute.
Evidence accumulates
Trips pool into a community record: "families here want to reach this park, and they're all forced across the same crossing."
The case gets made
That record, paired with the stress map, is what local governments need to justify and fund fixes — crossings, paths, calmer streets.
Local knowledge matters most where data is thinnest: many of the safest routes depend on neighborhood cut-throughs no public dataset records. If you know one, flag it on the map or email [email protected].
See what this data says about your community
If you work for a village, city, school district, or county, or you serve on a plan commission or bike/ped committee, the map and its community record can directly support your planning work:
- Safe Routes to School conversations and applications
- Comprehensive-plan and bike/ped-plan elements
- Grant applications (TAP, SRTS, HSIP) backed by demand evidence
- Spotting the low-cost moment: fixing a crossing when a road project is already coming
- Add your adopted plan's projects to the map — free, credited to your plan, shown to every resident who routes through your community
Free walk-through
I'll walk you through what the data shows about your community: the stress map, where residents are asking to ride, and the crossings standing in the way. There's no cost. I built this to be useful and to help make biking safer across Wisconsin.
Email [email protected]Find the calm way to ride
Free, statewide, and ready in your browser — no account needed.
Open the map